Written by Keith Hempshall, Director of Local & Community Empowerment at the Centre for Sustainable Energy
Through our history working with communities at the Centre for Sustainable Energy (CSE), know improving peoples understanding of their carbon footprint and providing insights and data that correspond directly to their community galvanises local commitment and action. But every community is different. And useful, accessible, and clearly interrogatable data is hard to come by. This is why we’ve created the Impact Community Carbon Calculator. ‘Impact’ shows where local emissions are highest, revealing which areas to focus on to make the biggest changes.
Images above come from our work in Bristol where we have been using the tool to help local community groups understand their carbon footprints and develop climate action plan. See here - Using Community Carbon Footprints to support Climate Action - Bristol Green Capital
It's true there are lots of carbon calculators already available, either commissioned by larger cities or for working out individual carbon use. Like the one provided by WWF. Impact caters for the bit in the middle – smaller community areas defined by parish or ward level. All communities are different, and it can be hard to know what to prioritise when organising community action and net zero plans. To make activities more efficient, Impact provides easy-to-understand data. This can be used to engage with communities and coordinate efforts in a meaningful way.
Impact presents data at parish, council, and ward level across England, Scotland, and Wales. It can also be accessed by searching with a postcode. The tool is completely free to use and draws from over 30 datasets to estimate the total emissions produced directly and indirectly from everyday activities in a local area. Emissions are shown in categories including home heating, transport, food and diet, and waste disposal. A percentage is allocated to each, helping pinpoint which areas will benefit most from action to reduce emissions. To get started, you can try it for yourself here.
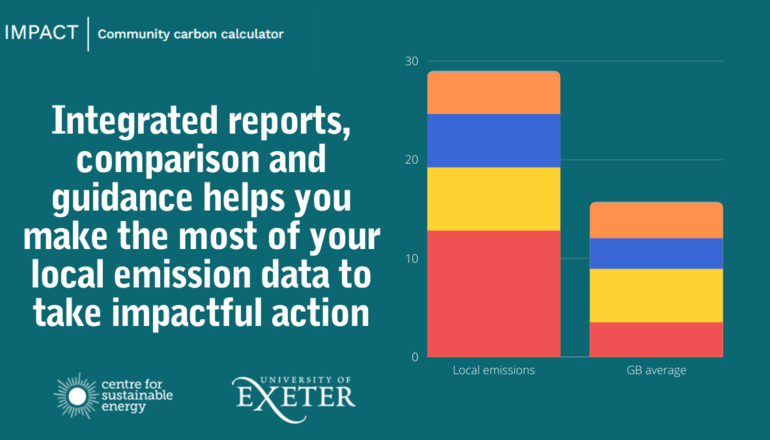
The tool allows you to compare your communities’ emissions with neighbouring areas and the national average too. You can easily see how your area is performing and which areas need attention. Within the tool, you can download an automated report which gives more insight into the data. It includes guidance on how to engage with your community, generating important buy-in for activities. To reduce emissions and reach net zero, everyone needs to play a part. For example, if housing emissions are high, you might want to promote the benefits of home retrofit or offer energy saving advice to your community, who can make changes in their own homes.
How Impact has influenced communities
Impact has shaped several communities’ climate action plans. In Winchester, Winchester Action on the Climate Crisis (WinACC) used the comparison tool to create visuals of home energy consumption. Using the data for electricity, gas, and non-gas heating fuels, WinACC created colour-coded maps of the 47 parishes and 5 wards in the district. Green indicated lower emissions and red higher, clearly showcasing where emissions differed. This eye-catching demonstration of Impact’s data makes it easy for communities to understand and engage with.
In Lyme Regis, Impact has been used to guide ongoing climate activity. Impact has helped to kick-start discussions around carbon footprints, especially why emissions might be different between areas. The data allows councils and parishes to start questioning what causes differences. For example, types of heating can influence home emissions, and popular tourist spots will attract more people, increasing transport emissions. Impact can help lead discussions into why something is happening, rather than simply presenting the facts. This can help communities take appropriate action for each category, as each will have its own reasons behind the emissions.
For other examples of how Impact has been successful, read the community stories. To explore your own emission data, visit the Impact site.